
Size matters: bioinformatics accurately detects short, fat antibiotic-resistant bacteria
Researchers from Osaka University find that antibiotic-resistant bacteria exhibit characteristic morphological changes that can be detected microscopically in the absence of antibiotics using a bioinformatics approach
Penicillin was hailed as “the silver bullet” when it was discovered, as it had the unprecedented quality of being able to kill disease-causing bacteria without harming the human body. Since then, a multitude of other antibiotics have been developed that specifically target a wide range of bacteria; but the more often they are used, the greater the risk that antibiotic-resistant strains will arise.
In a study recently published in Frontiers in Microbiology, researchers from Osaka University have revealed that bacteria exhibit characteristic shape differences when they are resistant to drug treatment.
Antibiotic resistance is a major public health problem worldwide, as it means that we have fewer and fewer options for treating bacterial infections. Identifying antibiotic-resistant bacteria quickly is important for ensuring that patients receive effective treatment; but the most readily available method for doing this involves several days of growing the bacteria in a lab and treating them with drugs to see how they respond.
“There is some evidence that antibiotic resistance reveals itself in other ways; for example, the morphology of Gram-negative rod-shaped bacteria changes when they are exposed to antibiotics,” says lead author of the study Miki Ikebe. “We were interested in determining whether this feature could be used to detect antibiotic resistance without actually treating the bacteria with antibiotics.”
To do this, the researchers exposed Escherichia coli to fixed concentrations of different antibiotics, prompting them to develop antibiotic resistance. They then removed the antibiotic treatment and used machine learning to assess the shapes, sizes, and other physical features of the bacteria based on microscope images.
“The results were very clear,” explains Kunihiko Nishino, senior author. “The antibiotic-resistant strains were fatter or shorter than their parental strains, especially those that were resistant to quinolone and β-lactams.”
Next, the researchers explored the genetic makeup of the antibiotic-resistant bacteria to see whether there was any connection between bacterial shape and antibiotic resistance. The results showed that genes related to energy metabolism and antibiotic resistance were indeed associated with the shape changes that were observed in the antibiotic-resistant bacteria.
“Our findings show that drug-resistant bacteria can be identified from microscope images, in the absence of antibiotics, using machine learning,” says Ikebe.
Given that the bacteria that were resistant to quinolone, β-lactams, and chloramphenicol all exhibited similar shapes and sizes, it seems likely that the same genetic mechanism is responsible for antibiotic resistance in all of these strains. In the future, a machine learning tool could be used to rapidly assess samples taken from patients to help prescribe the right drug to treat their infection.
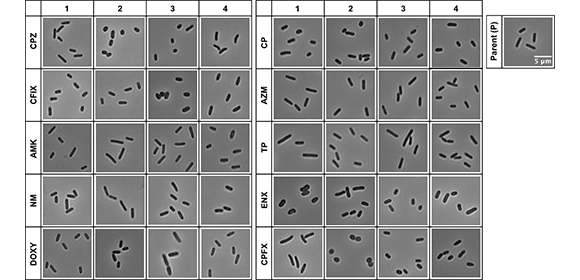
Fig. 1 Light microscopy of antibiotic-resistant strains.
Representative images of antibiotic-resistant Escherichia coli strains and the sensitive parental strain (P) from one of three datasets (Dataset 1) are shown. Four lines were isolated from each resistant strain, and the numbers at the top indicate the line of the resistant strain. The scale bar shown in the image of the parental strain applies to all panels. AMK = Amikacin; AZM = Azithromycin; CFIX = Cefixime; CP = Chloramphenicol; CPFX = Ciprofloxacin; CPZ = Cefoperazone; DOXY = Doxycycline; ENX = Enoxacin; NM = Neomycin; TP = Trimethoprim.
Credit: 2024 Nishino et al., Bioinformatic analysis reveals the association between bacterial morphology and antibiotic resistance using light microscopy with deep learning., Frontiers in Microbiology
Fig. 2 The results of k-means clustering and principal component analysis (PCA) of each cluster.
Upper left panel for each cluster: The pie charts indicate the proportion of the cluster occupied by each bacterial strain. Upper right panel for each cluster: The average shape of the cells in the cluster is shown; the solid line represents the mean and the dotted lines represent the standard deviation. The vertical and horizontal axes are in μm. Bottom panel for each cluster: The results of the PCA for each cluster are shown. The ellipse contains approximately 68% of the cells from each strain. The arrows represent the loadings of each feature. P = the parental strain; BL = β-lactam-, AG = aminoglycoside-, TC = tetracycline-, CP = chloramphenicol-, ML = macrolide-, TP = trimethoprim-, QN = quinolone-resistant strains; MaxFeret = maximum Feret’s diameter; MinFeret = minimum Feret’s diameter.
Credit: 2024 Nishino et al., Bioinformatic analysis reveals the association between bacterial morphology and antibiotic resistance using light microscopy with deep learning., Frontiers in Microbiology
Fig. 3 Single-cell classification of parental and antibiotic-resistant cells using deep neural networks.
A
: The classification workflow. The insets show enlarged views of the contours of the cell region extracted from microscopy images of the parental and resistant (ENX) strains. The corresponding cell contours aligned horizontally and evenly interpolated to 128 points are shown as these formed the input data. A cartoon of the deep learning architecture shows a circular convolution (circ-conv) integrated into the ResNet architecture. For the circ-conv layer, r represents the radius or neighborhood size, resulting in a kernel size of 2r+1, followed by the number of channels and optionally a stride. The circ-conv layers are followed by batch normalization and rectified linear unit functions. The curved arrows depict a shortcut connection, and the dashed lines indicate the increase in the number of channels. The term fc stands for a fully-connected layer. Threefold cross-validation was conducted for evaluation of the classifier models.
B: The receiver operating characteristic (ROC) curve for the contour classification. Each curve shows an average of the ROC curves obtained from the threefold cross-validation. The vertical and horizontal axes represent the values of sensitivity and 1 − specificity, respectively.
C: Performance of the network in classifying resistant strains. The classification results (mean values) from the test sets in the threefold cross-validation are presented as bar graphs with standard deviations. The resistant strains are listed in descending order of the area under the curve (AUC). Sens. = sensitivity (correctly classified resistant cells); Spec. = specificity (correctly classified parental cells). Accu. = accuracy (collectly classified parental and resistant cells); AMK = Amikacin; AZM = Azithromycin; CFIX = Cefixime; CP = Chloramphenicol; CPFX = Ciprofloxacin; CPZ = Cefoperazone; DOXY = Doxycycline; ENX = Enoxacin; NM = Neomycin; TP = Trimethoprim; AR = aspect ratio; Circ = circularity; MaxFeret = maximum Feret’s diameter; MinFeret = minimum Feret’s diameter; Perim = perimeter; Round = roundness; Solid = solidity.
Credit: 2024 Nishino et al., Bioinformatic analysis reveals the association between bacterial morphology and antibiotic resistance using light microscopy with deep learning., Frontiers in Microbiology
The article, “Bioinformatic analysis reveals the association between bacterial morphology and antibiotic resistance using light microscopy with deep learning,” was published in Frontiers in Microbiology at DOI: https://doi.org/10.3389/fmicb.2024.1450804.