
Developed a new method to interpret spectroscopic images from the perspective of connections between spaces
Elucidated unknown information about diseases and foreign substances
- In spectroscopic imaging, which uses light to examine molecular information, an analytical method focuses on similarities in the surrounding chemical environment has been developed.
- The research group has succeeded in obtaining information that could not be captured through conventional analyses based on shape observation or chemical information alone.
- Since it can detect low sensitive and unknown material patterns, application to detecting foreign substances in biological tissue is expected.
Outlines
A research group including Professor Tamiki Komatsuzaki of the Institute for Chemical Reaction Design and Discovery (WPI-ICReDD) and the Research Institute for Electronic Science (RIES), Hokkaido University, in collaboration with Professor Katsumasa Fujita of the Graduate School of Engineering, the University of Osaka, and Professor Yoshinori Harada of the Graduate School of Medical Science, Kyoto Prefectural University of Medicine, has succeeded in defining a new scale that represents the chemical surrounding environment for Raman spectroscopy measurements and developing a new analytical method based on it.
This microscope can examine biological tissue with light and record information related to the types and amounts of molecules in an image-like format. However, conventional analyses only focused on the type of molecule itself and did not give much attetntion to its relationship with the surrounding environment.
In this study, the research group developed a method to quantify the difference between the molecular information of each point and its surroundings (spatial heterogeneity) and used this information to classify tissues. As a result, they have succeeded in capturing previously unseen characteristics of diseases and chemically inconspicuous foreign substances. This paves the way to finding substances with low signals and unknown substances, which have previously been difficult to detect. In particular, it is expected to be applied to the detection of asbestos and microplastics, and the discovery of special molecules that exist locally within tumors.
Figure: Comparison of city map and Raman image of liver tissue
It has been elucidated that diagnostic accuracy can be improved by adding spatial direction information to Raman images, which contain hundreds of colors compared to the three colors of RGB.
Credit: Katsumasa Fujita
Research Background
How did you decide where to live? Employees of the same company or students attending the same school tend to live near the same station, workplace, or school. On the other hand, there are a certain number of people who prefer to build a house alone in the mountains and live a self-sufficient life. Considering the geographical and spatial context of many data reveals similar patterns and spatial structures, and then diversity within regions can be understood. The former is a situation where the spatially adjacent environments are similar, while the latter is the opposite, where the house is different from its surroundings.
Similarly, in living organisms, molecules such as proteins and lipids are not scattered randomly, but form spatial structures in order to efficiently perform specific functions. For example, while substances such as fat are widely scattered in the liver, vitamin A is concentrated and accumulated in specific areas and significantly involved in repair and progression of liver damage.
Raman microscopy can be used to investigate the types and distribution of molecules within such biological tissues. The Raman microscopy precisely separates and observes the wavelengths of the specific light (Raman scattered light) emitted from a sample. Each wavelength reflects the type of molecule, and the intensity of the light reflects the amount of molecules, so it is possible to determine which molecules are present, where, and in what quantities. The obtained image resembles a normal photograph but contains an overwhelming amount of information. While a typical photograph contains information on only three colors of light: red, green, and blue, the image data obtained by a Raman microscopy contains detailed information on hundreds of colors (wavelengths) for each pixel.
In this image data, each pixel has hundreds of features (intensity of scattered light for each wavelength), and this type of multidimensional data is called a spectrum. Using multivariate analysis, the differences in the spectra can be interpreted and color-code (group) can be classified according to chemical properties, such as "this pixel contains a lot of vitamin A." However, conventional analyses were like classifying a jigsaw puzzle piece by looking at only the pattern on the piece. The focus has been solely on the chemical information contained in each pixel (puzzle piece), while the spatial context, such as the location of the piece and its relationship to adjacent pieces, has been ignored.
Research Method
In this study, the research group compared spectra within a local area, i.e., a certain pixel and its surroundings, and newly defined the difference as spatial heterogeneity (Fig. 1). This makes it possible to quantitatively evaluate not only the characteristics of individual spectra, but also the degree of variability among many spectra within a range. This difference between spectra was quantified, and a histogram (distribution diagram) was created from the data group of differences that each pixel had, and the images were classified based on the shape of the histogram.
For classification, the researchers used an information-theoretic technique called the information bottleneck method. Its advantage is the possibility of flexible allocation of ambiguous data that is difficult to classify, such as "60% belongs to group A, 40% belongs to group B." This prevents measurement errors from misclassifying the data into groups. Furthermore, the fineness of the classification can be controlled numerically, which helps to avoid excessive and meaningless divisions beyond the noise level.
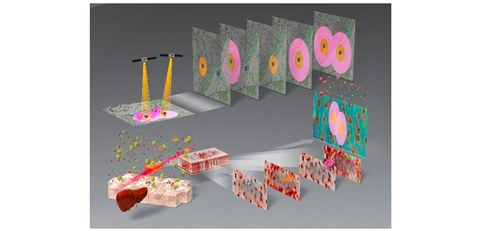
Fig. 1 Overview of the procedure for quantifying the spatial heterogeneity of each pixel
The far-left image indicates an example of a two-dimensional Raman image, where the molecular characteristics (Raman shifts) correspond to the RGB color images in the photograph. In this study, the research group quantified the spatial heterogeneity of a certain pixel (point). First, they focused on a pixel in the image (the central pixel) and calculated the chemical difference (center image) between each pixel and the many surrounding pixels. Next, they compiled the data for the many calculated differences and created a graph (histogram) showing their distribution (see the far-right image). The shape of this histogram represents the spatial characteristics of that pixel.
Credit: Katsumasa Fujita
Research Results
In this study, in order to apply the newly developed method to actual medical issues, the liver tissue of rats with non-alcoholic fatty liver disease (NAFLD) was measured and analyzed using a Raman microscopy.
Using livers that had developed mild non-alcoholic fatty liver (NAFL) and more severe non-alcoholic steatohepatitis (NASH) after being fed a high-fat diet, the results of the pathological diagnosis by a pathologist were compared with the results of the research group's analysis.
Analysis using the proposed method confirmed that the local chemical environment in tissues with severe NASH is spatially homogeneous. Also, some of the tissues diagnosed with mild NAFL already exhibited the homogeneous pattern seen in NASH. This finding would have been overlooked in conventional analyses based solely on chemical information or on microscopic observations, which depend on morphological information from stained tissue. Furthermore, by comparing the results of the conventional method (chemical information) and the proposed method (spatial information), the research group found that the increase or decrease of specific molecules and the homogenization of the local chemical environment occur simultaneously. In addition, some NASH tissues were found to diverge from this trend. Comparing the molecular distribution map with the classification results shows the presence of blood that is spatially non-uniformly distributed, which is difficult to characterize using conventional methods.
The method proposed in this study indicated that it is possible to sensitively detect differences in spatial characteristics (heterogeneity) and the presence of specific molecules (such as blood) in tissues that appear homogeneous at first glance, which could not be detected by conventional chemical analysis alone.
Fig. 2 Comparison of molecular distribution and classification results in liver tissue using both new and conventional analytical methods
Molecular distribution and analysis results for liver tissue from rats fed a high-fat high-cholesterol diet (HFHC).
a) Distribution map of each molecule, cytochromes, hemoglobin, vitamin A, and lipids captured with a Raman microscopy. The brighter part of the image (higher intensity) indicates the existence of more molecules. Hemoglobin can be seen distributing in a characteristic way in the tissue of the special example on the lower left and in the area circled in black in the typical example on the lower right.
b) Comparison of analysis results using both conventional and new methods. The top row indicates the results using a new method developed in this study also taking spatial information into account.
The difference in color represents the uniformity of the chemical environment (the higher the index, the more uniform the chemical environment), and the special cases and black circles where hemoglobin was characteristic are clearly identified as heterogeneous regions (blue) that differ from the surrounding area.
The bottom row shows the analysis results using only conventional chemical information. The difference in color primarily reflects the amount of fat (the higher the index, the more fat). Areas with sparse hemoglobin distribution were classified into clusters similar to the surrounding fatty areas and could not be classified. In particular, in special cases, it is clear the samples belong to almost the same cluster and cannot be classified.
Credit: Katsumasa Fujita
Future Development
In June 2023, NAFLD and NASH, the research subjects in this study, were renamed metabolic dysfunction-associated steatotic liver disease (MASLD) and metabolic dysfunction-associated steatohepatitis (MASH) respectively. Because their diagnostic criteria are very similar, it is believed that the findings obtained in this study, such as homogenization of the local chemical environment, will contribute to the understanding and diagnosis of pathologies under the new disease criteria.
By controlling the scale (range) of analysis, this method can also be applied to a completely different problem: detecting foreign substances with specific shapes hidden within biological tissue.
For example, asbestos and microplastics, which are of concern for their health hazards, are included. Even if the signal emitted by a foreign substance is very weak or the exact characteristics (spectrum) of the molecule are unknown, this method can reveal its presence by detecting the slight disturbance in the chemical environment that occurs around the foreign substance.
Notes
The article, “Integrating spatial and chemical information enhances differentiation of non-alcoholic steatohepatitis states in Raman imaging,” was published in Scientific Reports at DOI: 10.1038/s41598-025-17495-z