
Digitalizing design for stem cell cultivation processes for regenerative medicine
- A research group developed a new algorithm to determine a design space (DS), an operating condition that meets quality requirements, for the cultivation process of mesenchymal stem cells (MSCs), a critical cell source for regenerative medicine.
- By using a physical model based on mass balance and statistical prediction intervals for the model parameters, it became possible to identify DS that simultaneously consider the dynamic characteristics and variability of cell growth, and successfully verified its validity through experiments.
- This algorithm made it possible to determine DS in a digital space through simulation, contributing to rapid and efficient process design and commercialization of stem cell products.
Outlines
A research group led by Professor Hirokazu Sugiyama, Assistant professor Yusuke Hayashi, and a graduate student Keita Hirono (at the time of research) at Department of Chemical System Engineering, Graduate School of Engineering, The University of Tokyo, in collaboration with Professor Masahiro Kino-oka and others at Graduate School of Engineering of The University of Osaka, developed a new algorithm to determine the design space (DS), which is the operating condition that meets quality requirements, for the cultivation of mesenchymal stem cells (MSCs) for regenerative medicine and have successfully verified its validity through experiments. Recently, the pharmaceutical industry has placed great importance on drug manufacturing based on DS. However, MSC cultivation is a complex phenomenon involving living cells, making it extremely difficult to identify DS using conventional experimental investigations. At the same time, although it has been clarified that methods using mathematical models are useful for determining DS in MSC cultivation, there has been a problem that the obtained DS has not been sufficiently verified through experiments. In response to this, the research group developed a new algorithm that uses a physical model based on material balance and statistical prediction intervals for the model parameters to determine DS while simultaneously considering the dynamic characteristics and variability of cell growth. Furthermore, the researchers successfully verified the validity of DS in cultivation process for MSC identified through simulation through experiments. By using the developed algorithm, it is possible to identify DS in digital space and is expected to contribute to rapid and efficient process design and the commercialization of stem cell products without relying on trial-and-error experiments.
Research Background
There is a growing demand for MSCs to be used in the radical treatment of intractable diseases such as spinal cord injury. In recent years, the pharmaceutical industry has been promoting Quality by Design in quality control, and drug manufacturing based on DS is considered particularly important. Although attempts to identify DS have been made through experiments, it is not easy to simultaneously analyze the dynamic characteristics and variability of cell growth in complex phenomena involving living cells, such as MSC cultivation, making it extremely difficult to identify DS through experimental validation. At the same time, although it has been clarified that methods using mathematical models are useful for determining DS in MSC cultivation, there has been a problem that the obtained DS has not been sufficiently verified through experiments. For these reasons, there was a need for a new methodology utilizing digital technology to experimentally verify DS obtained through simulations while expanding the scope of application of methods using mathematical models.
Research Contents
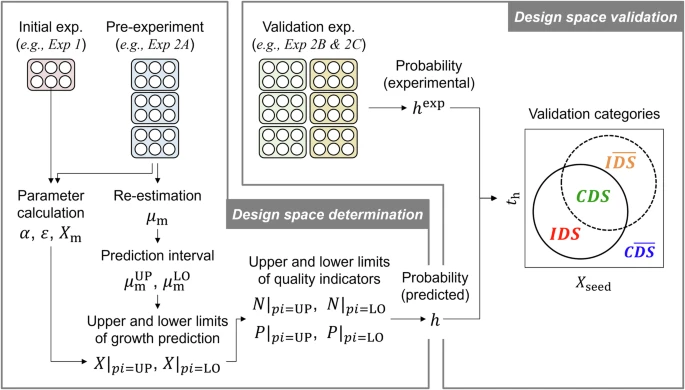
In this study, the research group developed a new algorithm that can identify DS by simultaneously considering the dynamic characteristics and variability of cell growth by using a physical model based on mass balance and statistical prediction intervals of the model parameters, and successfully verified its validity through experiments (Fig. 1). First, the researchers used existing physical models to determine a basic set of parameters that would reproduce the data from the initial experiments. Next, they re-estimated the parameters related to cell growth speed using the pre-experimental data and updated the model (Fig. 2a). The predictive accuracy of the model was confirmed using data from a validation experiment (Fig. 2b). Furthermore, the research group calculated the statistical prediction intervals of the re-estimated parameters and input the upper and lower end values for the simulation to predict the upper and lower limits of cell growth (Fig. 2c). Additionally, they predicted dynamic fluctuations of cell growth through stochastic simulation (Fig. 2d) and calculated the probability that the simulation results would simultaneously meet the quality requirements for cell number and confluence. As a result of the calculation, the combination of seeding density and culture end date with a probability of 90% or higher was defined as DS (Fig. 3a). Finally, by comparing the predicted results with those of a validation experiment, the validity of the obtained DS was verified (Fig. 3b). As a result, it was experimentally confirmed that 11 of the 12 culture conditions predicted to be included in the DS met the quality requirements. The validity of this algorithm was also demonstrated when using pre-experimental data obtained from different experimenters and when the probability was specified as 50% or 70% (Fig. 4), suggesting the possibility of application of the result.
This algorithm is thought to be widely applicable even when the MSC-derived donor or biological tissue are different, or when the culture environment, such as the culture medium or culture scale, is changed by adopting an appropriate physical model. Furthermore, the mathematical models and simulations used in this research are expected to be applicable in a wide range of scenes, from basic research on MSC cultivation to process development and commercial production.
Fig. 1: New algorithm for determining DS and experimental validation
Exp. 2A, 2B, and 2C were conducted by three different experimenters, A, B, and C, respectively
CDS: correctly identified feasible condition; C(DS): correctly identified infeasible condition; IDS: incorrectly identified feasible condition; and I(DS): incorrectly identified infeasible condition.
Credit: Masahiro Kino-oka
Fig. 2: An example of calculation using re-estimated model parameter and prediction interval
a. Model prediction accuracy before and after re-estimation; b. Verification of model prediction accuracy after re-estimation; c. Simulation with prediction intervals; d. Monte Carlo Simulation
The black solid line represents the predicted value before re-estimation, the red dotted line and orange solid line represent the predicted value after re-estimation, the green solid line represents the upper limit of the prediction, and the blue solid line represents the lower limit of the prediction.
NRMSE stands for normalized root mean square error, and the closer it is to 0%, the higher the accuracy.
Credit: Masahiro Kino-oka
Fig. 3: DS determination and experimental validation
a. DS determined from simulation results; b. Result of experimental validation
A DS boundary where the probability is 90% (inside black lines); correctly identified feasible condition (green dots); incorrectly identified infeasible condition (red dots); incorrectly identified feasible condition (yellow dots), correctly identified infeasible condition (blue dots)
Credit: Masahiro Kino-oka
Fig. 4: Results of experimental validation of DS for different experimenters and probabilities
Exp. 2A, 2B, and 2C were conducted by three different experimenters, A, B, and C, respectively. The area enclosed by the black border represents DS with the specified probability. The legend for the colored dots is the same as in Fig 3.
Credit: Masahiro Kino-oka
Future Developments
In this study, the research group developed a new algorithm for determining DS that simultaneously consider dynamic characteristics and variability in the MSC cultivation process and successfully verified it through experiments. This has made it possible to design MSC cultivation using mathematical models and simulations, without relying on trial-and-error experiments. In the future, further modeling will be proceeded to identify DS that incorporates a wider range of quality requirements. Through this research, the research group will contribute to more advanced design and control of culture processes, and ultimately to the further utilization of digital technology in stem cell processes.
Note
The article, “Determination and validation of design space for mesenchymal stem cell cultivation processes using prediction intervals,” was published in Communications Biology at DOI: 10.1038/s42003-025-08063-2