
Successful visualization of cellular differentiation
Application of "cell fingerprints" through Raman scattering spectrum
By making use of Raman scattering spectroscopy, a group of researchers from Osaka University and RIKEN succeeded in identifying a cell's differentiated state in an unstained an non-invasive way and visualizing changes of a cell's state during cell differentiation.
- Laboratory for Comprehensive Bioimaging, Quantitative Biology Center, RIKEN -- ICHIMURA Taro (Researcher), WATANABE Tomonobu (Team leader)
Immunology Frontier Research Center, Osaka University -- FUJITA Hideaki (Associate Professor)
To determine the type of cell and the state of differentiation -- such as telling the difference between normal cells and cancer cells and the separation of induced pluripotent stem cell (iPS cells) -- information about genes and expression and mutual interaction of proteins have been utilized in recent years. However, such conventional methods require breaking cells or dying them with fluorescent antibodies, damaging the cells in the process. Thus, development of methods for identification without damage have been greatly sought after.
Molecules begin vibrating with characteristic frequency when a beam of light is impinged upon them. A change in the frequency of this light is called Raman scattering. Since a cell is composed of various substances, individual cells' Raman scattering spectrum may vary depending on the type and content ratio of substances contained.
This joint group called this information for identifying the type and state of a cell "cell fingerprint." They confirmed that the Raman scattering spectrum was different according to the type and state of cells and developed a mathematical method for identifying them.
By making use of this technique, this group examined the Raman scattering spectrum in the process of initial differentiation of embryonic-stem-cells and muscle differentiation and found that cells in the process of differentiation are less stable than before or after the differentiation and that the Raman scattering spectrum coordinates were widely distributed.
This technique enables researchers to identify the type and status of cells by just analyzing scattering light at the time when light is shed on the cell. This technique does not require one to break cells and has less toxicity than conventional methods. Since it is based on microscopic techniques, this technique will make it possible to identify the type and state of the cell at single cellular level.
Abstract
Using Raman spectral imaging, we visualized the cell state transition during differentiation and constructed hypothetical potential landscapes for attractors of cellular states on a state space composed of parameters related to the shape of the Raman spectra. As models of differentiation, we used the myogenic C2C12 cell line and mouse embryonic stem cells. Raman spectral imaging can validate the amounts and locations of multiple cellular components that describe the cell state such as proteins, nucleic acids, and lipids; thus, it can report the state of a single cell. Herein, we visualized the cell state transition during differentiation using Raman spectral imaging of cell nuclei in combination with principal component analysis. During differentiation, cell populations with a seemingly homogeneous cell state before differentiation showed heterogeneity at the early stage of differentiation. At later differentiation stages, the cells returned to a homogeneous cell state that was different from the undifferentiated state. Thus, Raman spectral imaging enables us to illustrate the disappearance and reappearance of an attractor in a differentiation landscape, where cells stochastically fluctuate between states at the early stage of differentiation.
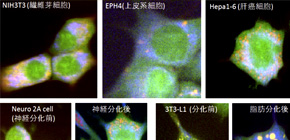
Figure 1. Each color in the cell represents the difference of the Raman spectra. The colors of the cytoplasm and cell nucleus depend on the type of cells or on the stage of cell differentiation.
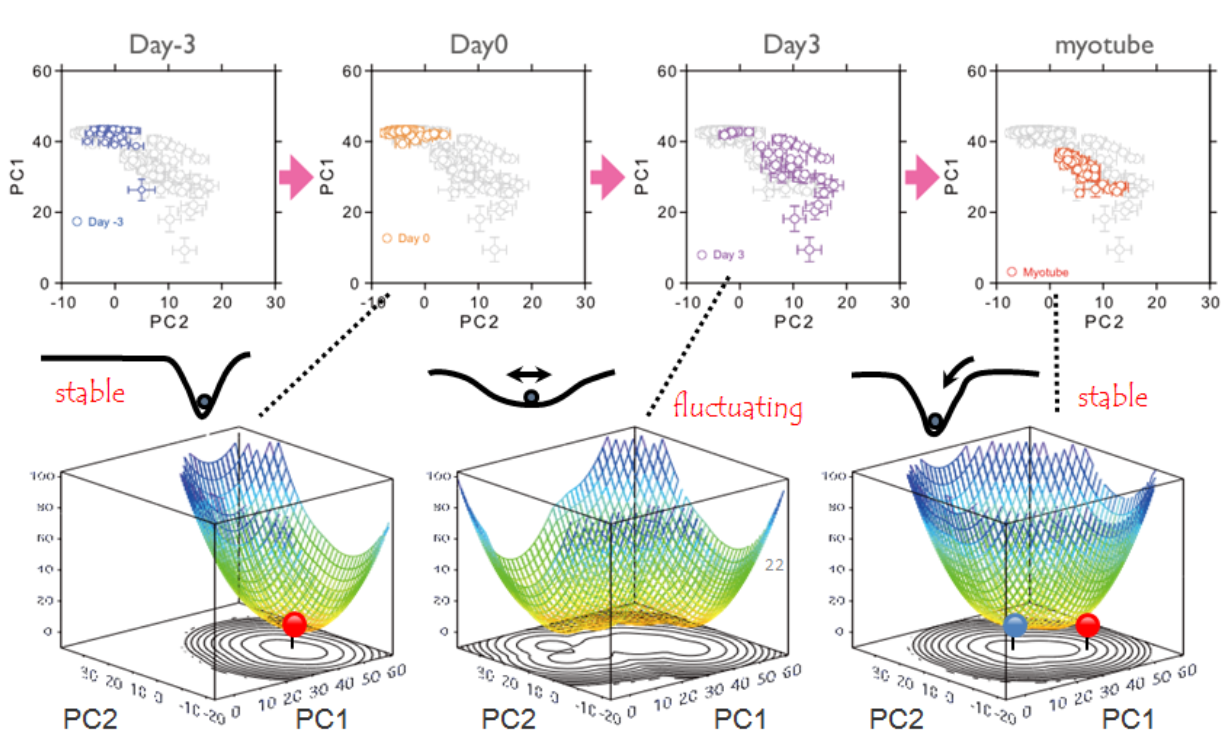
Figure 2. The potential landscapes in cell differentiation using Raman spectral imaging
To learn more about this research, please view the full research report entitled " Visualizing the appearance and disappearance of the attractor of differentiation using Raman spectral imaging " at this page of the Scientific Reports website.
Related link